Semester: M.1.2
Course: Constructive Design Research
In this course, my group and I conducted design research based on the open-source data of an anonymous Fitbit user. We asked two groups of design students to work with this data independently: one group designed a persona, and the other developed a design concept. Afterwards, the two groups came together to compare their results and reflect on any (mis)matches between the persona and the design.
We discovered a significant mismatch. Both groups had made assumptions based on fabricated context data and had misinterpreted or overlooked key aspects of the dataset. The design, for instance, targeted a young, outgoing person, whereas the persona represented someone older and more introverted.
This research highlighted the importance of approaching data-driven design diffractively [13], by critically questioning the data and engaging with it through a variety of methods, tools, and technologies.
Data visualizations of the raw Fitbit data of one anonimous user, presented on info sheets in envelopes, include categories like BMI, personality traits (IPIP), and sleep efficiency.


The set-up of the design group (left) and the set-up of the persona group (right).

The design that was created (left) and the persona that was created (right).
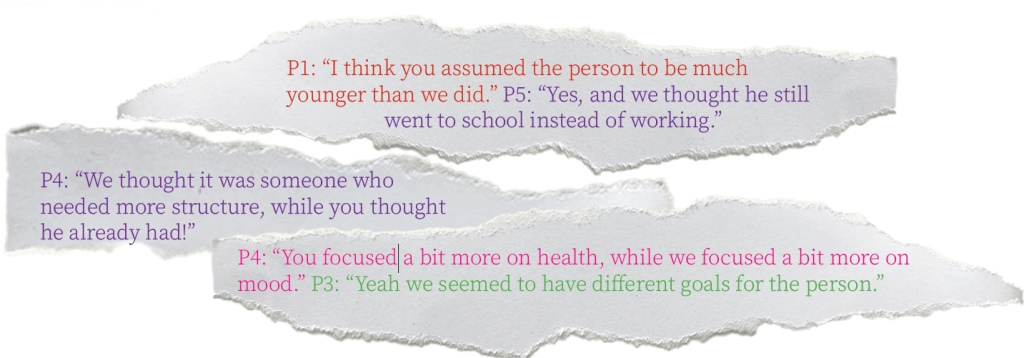
Some snippets from the discussions that emerged when the two groups of students came together.
My development
Until this course, I had not developed much knowledge or skill in the expertise area of Math, Data & Computing (MD&C). However, this project required my group and me to work with quantitative open-source Fitbit data and design accordingly. We created visualisations of the raw data, inspired by the Datastroming method [18], to make it more comprehensible for workshop participants. We found that participants struggled to design using these visualisations alone, due to a lack of contextual information. This experience taught me that diffractive data-driven design aligns with my vision as a designer, because it emphasizes that data is always collected, interpreted, and used by people, which means bias and context must always be taken into account.